From Federal Data to Actionable Risk Scores
Federal Data, Unified Scoring
From bridge inspections to water violations to freeze thaw exposure. One platform scoring your entire infrastructure portfolio.
Built for Every Role in Public Works
Prioritize Capital Improvements With Scored Federal Data
You manage bridges, water mains, and storm drains across your entire jurisdiction. InfraSift ranks every asset by risk score so you can direct limited maintenance budgets to the infrastructure that needs it most. Every score traces to FHWA condition ratings, EPA violation records, and NOAA weather data. Present the rankings at budget hearings with full data provenance.
Key Capabilities
Unified view of every pipe, road, bridge, and building in your jurisdiction with spatial data, material composition, age, and real time condition ratings.
ML models analyze 311 calls, inspections, weather, and permits to predict water main breaks, road deterioration, and sewer collapses 60 to 90 days before they happen.
Every asset receives a transparent, explainable risk score. Identify which pipes, bridges, and roads are most likely to fail so you can prioritize maintenance before emergencies.
Freeze thaw cycle tracking is the number one predictor of water main breaks in Ohio. InfraSift integrates NOAA weather data to quantify climate driven infrastructure stress.
Ingest and resolve entities across fragmented municipal systems including 311 calls, EPA water records, FHWA bridge data, permits, and code violations into a single unified graph.
H3 hex grid aggregation and PostGIS-powered spatial queries reveal failure patterns across neighborhoods. See which areas face compounding risk from multiple asset types.
AI powered analysis of inspection reports identifies deterioration patterns. Structured signals are extracted from free text inspection notes that human reviewers miss.
Citizen complaints are leading indicators of failure. InfraSift uses NLP to extract infrastructure signals from service requests and map them to at risk assets.
Role based access, audit logging, and tenant isolation keep your infrastructure data secure with enterprise grade encryption at rest and in transit.
Resources
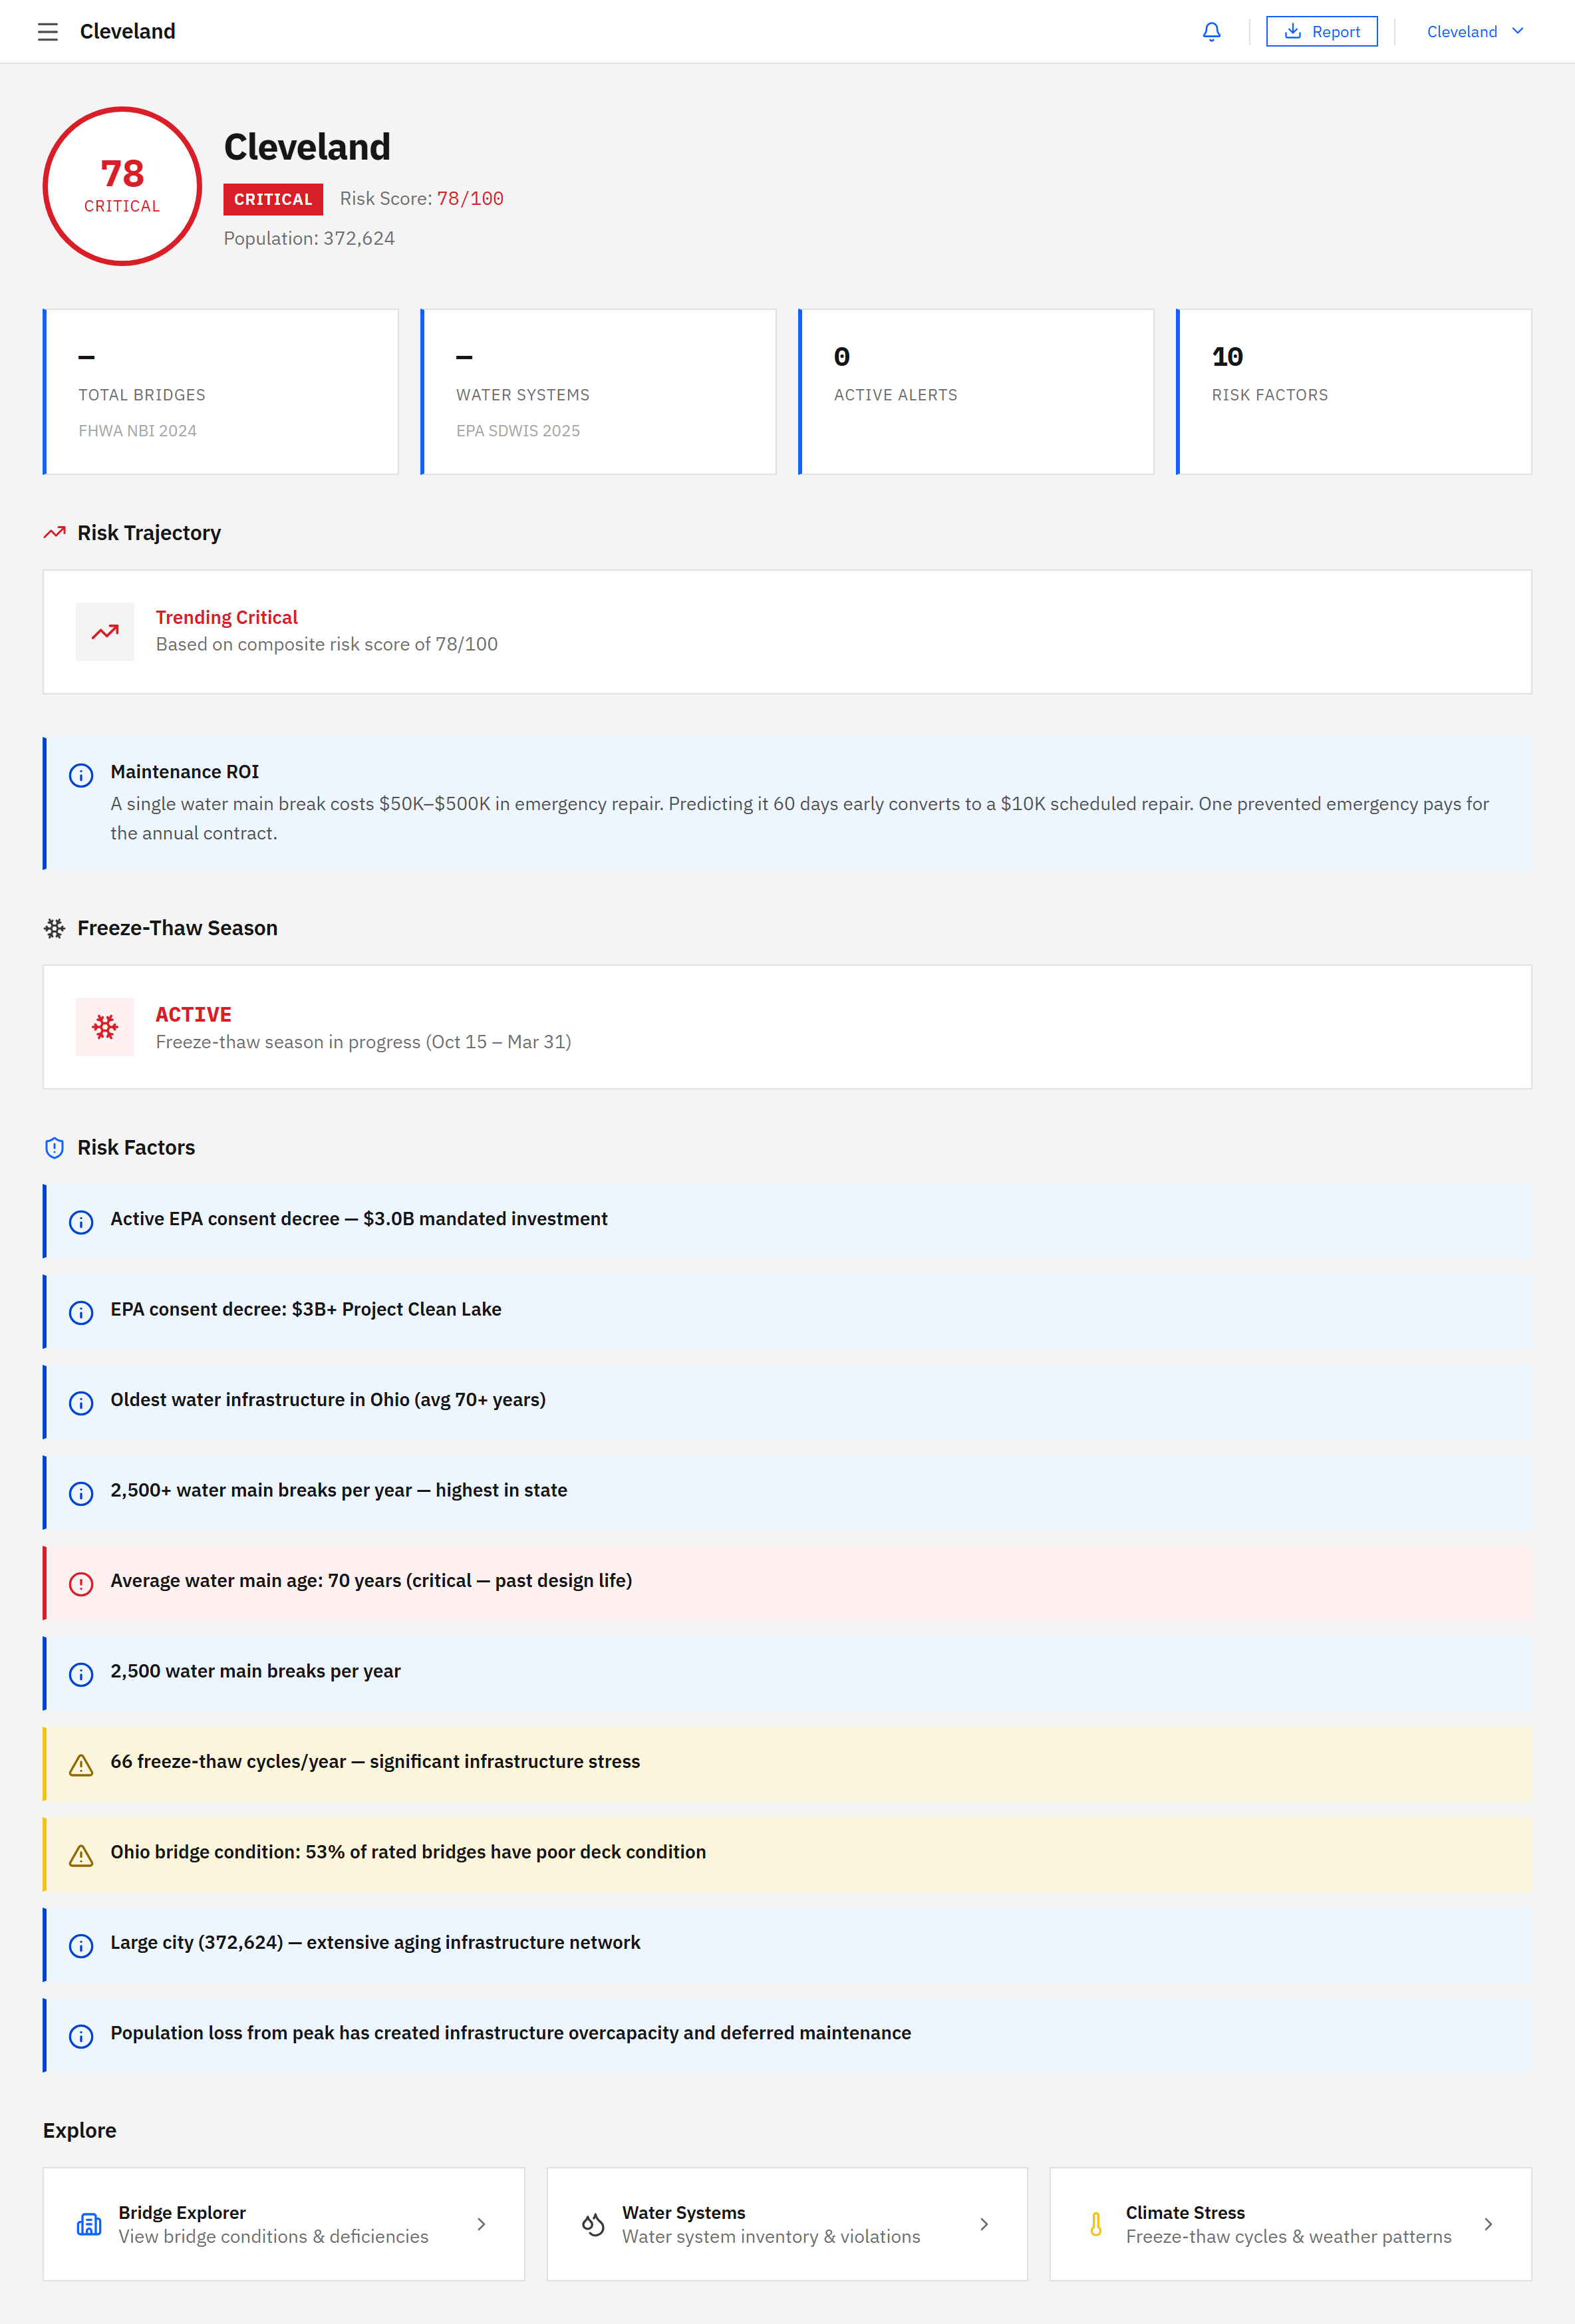
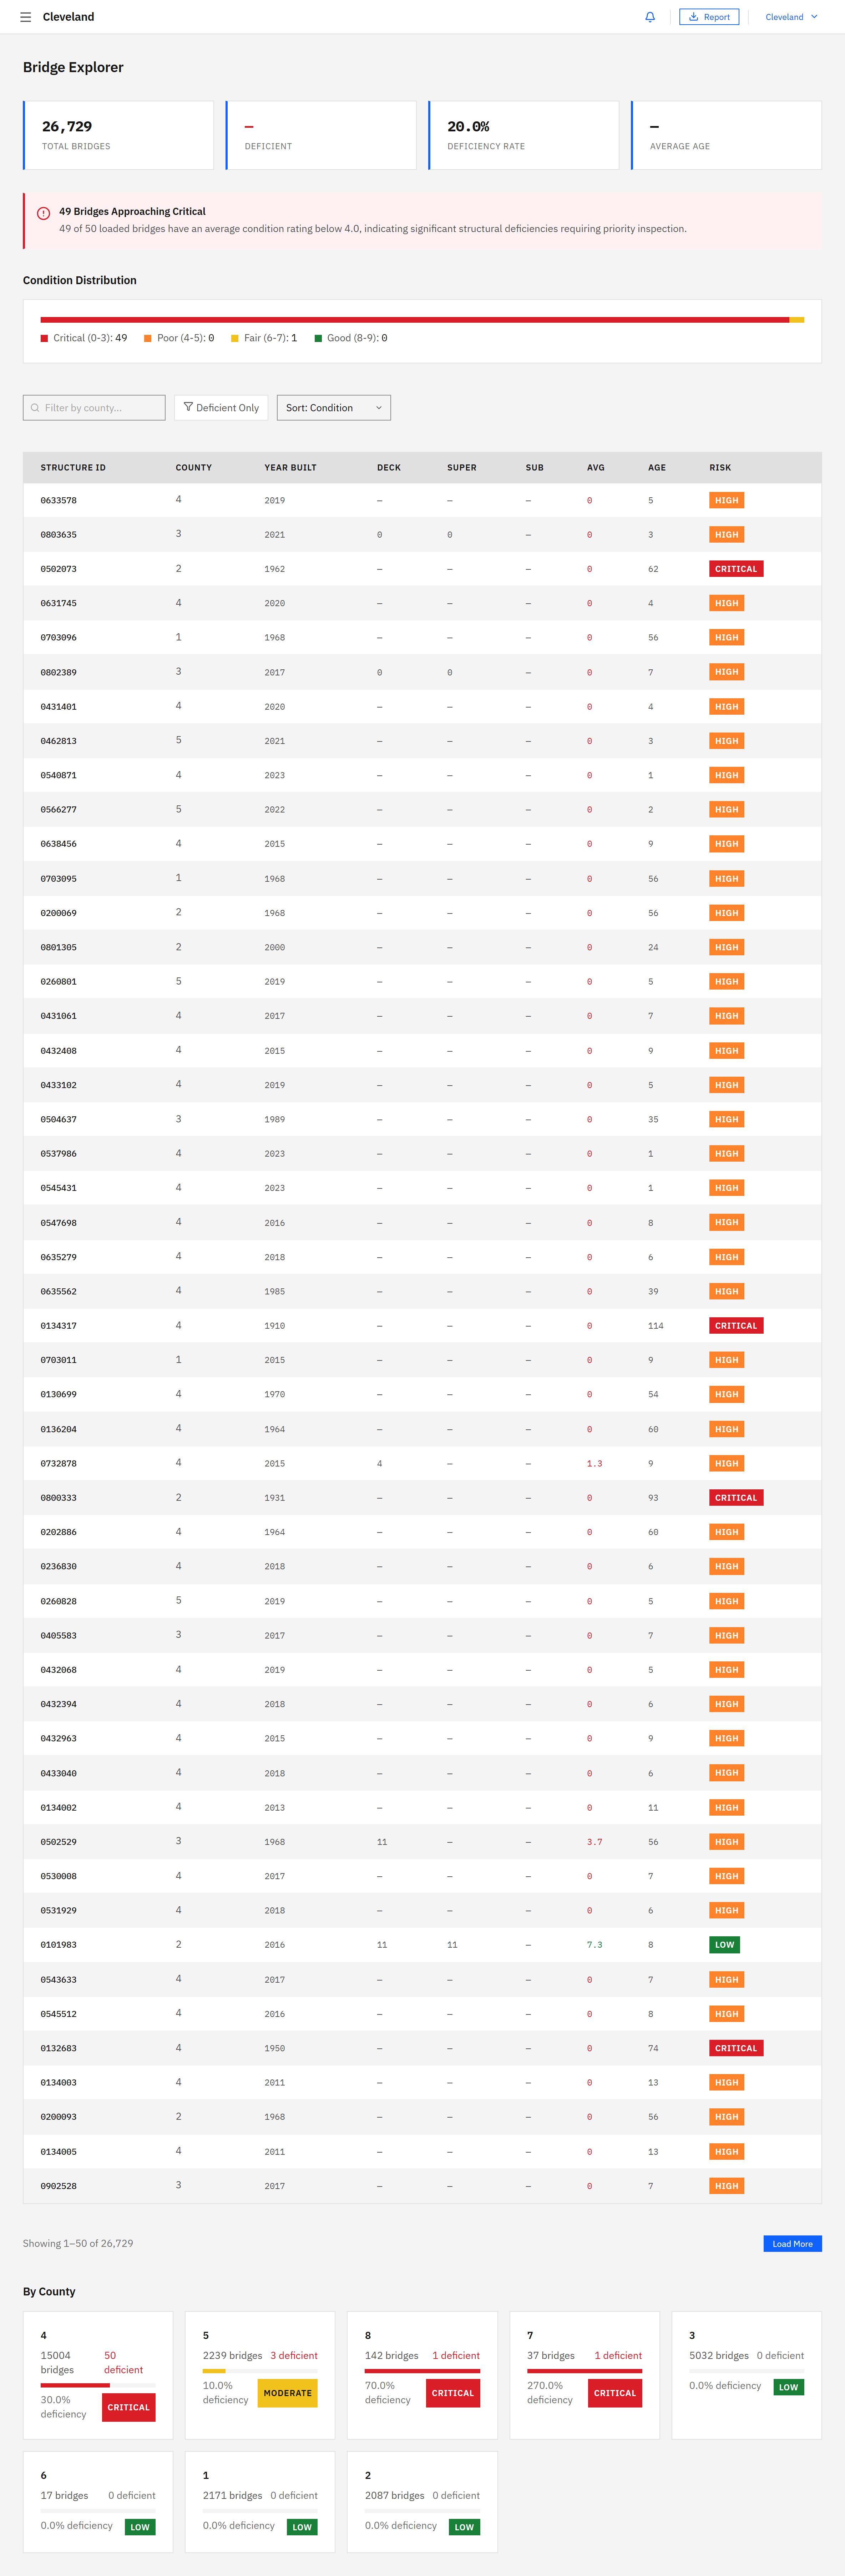
Complete bridge, water, and climate risk assessment for the City of Cleveland.
Infrastructure risk scores across Franklin County bridges, water systems, and weather exposure.
Hamilton County bridge condition, water compliance, and freeze thaw stress analysis.
Request Your City's Free
30-Day Pilot
We will generate a complete risk profile for your city using federal bridge, water, and weather data. No cost, no commitment, no sales pitch. You receive a scored and ranked assessment of your infrastructure within 30 days.